Yield Curves for Dummies, Reprise
Last week The United States Federal Reserve released a document about inverted yield curves and recession correlation. Our question: Why does yield curve inversion imply a potential recession? We hope the following helps some. First the statistics.
The Data Dependent Take
Lately major financial websites and several banks (Mitsubishi, and DB to name 2) have been separately addressing this with statistically backed assertions. Here is a sampling:
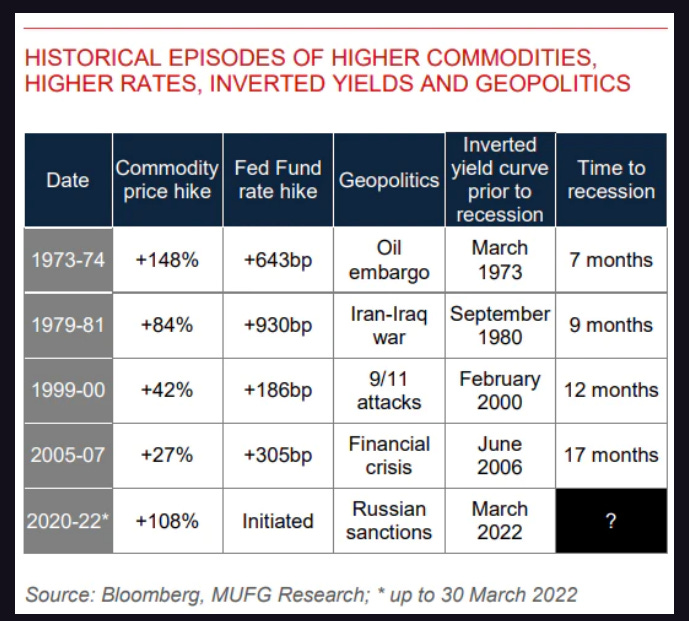
Mitsubishi Bank, the largest in Japan:
On only four occasions since the 1970s have soaring commodity prices, rising interest rates, an inverted yield curve, and geopolitical risks simultaneously blended together. On each of these occasions, the global economy witnessed a recession within the subsequent 11 months, on average.- Source-1, Source-2
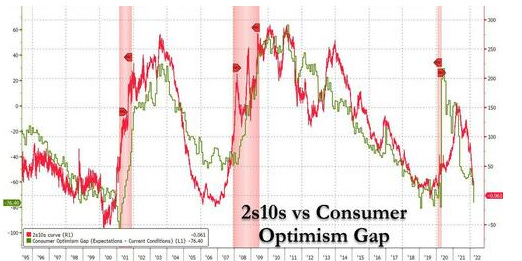
…we will merely show a chart comparing the 2s10s and superimpose the Consumer Optimism Gap (as defined by the spread between the Conference Board Expectations and the Current situation), to show the clear correlation and that a plunge in the 2s10s coincides with a collapse in optimism… and the start of a recession.- Source
DeutscheBank’s Jim Reid:
Every recession in the last 70 years has only happened AFTER the 2s10s has inverted. We have now seen an inversion on March 29th intra-day and again on March 31. History would say US recession risks are now elevated 12-24 months out.- Source
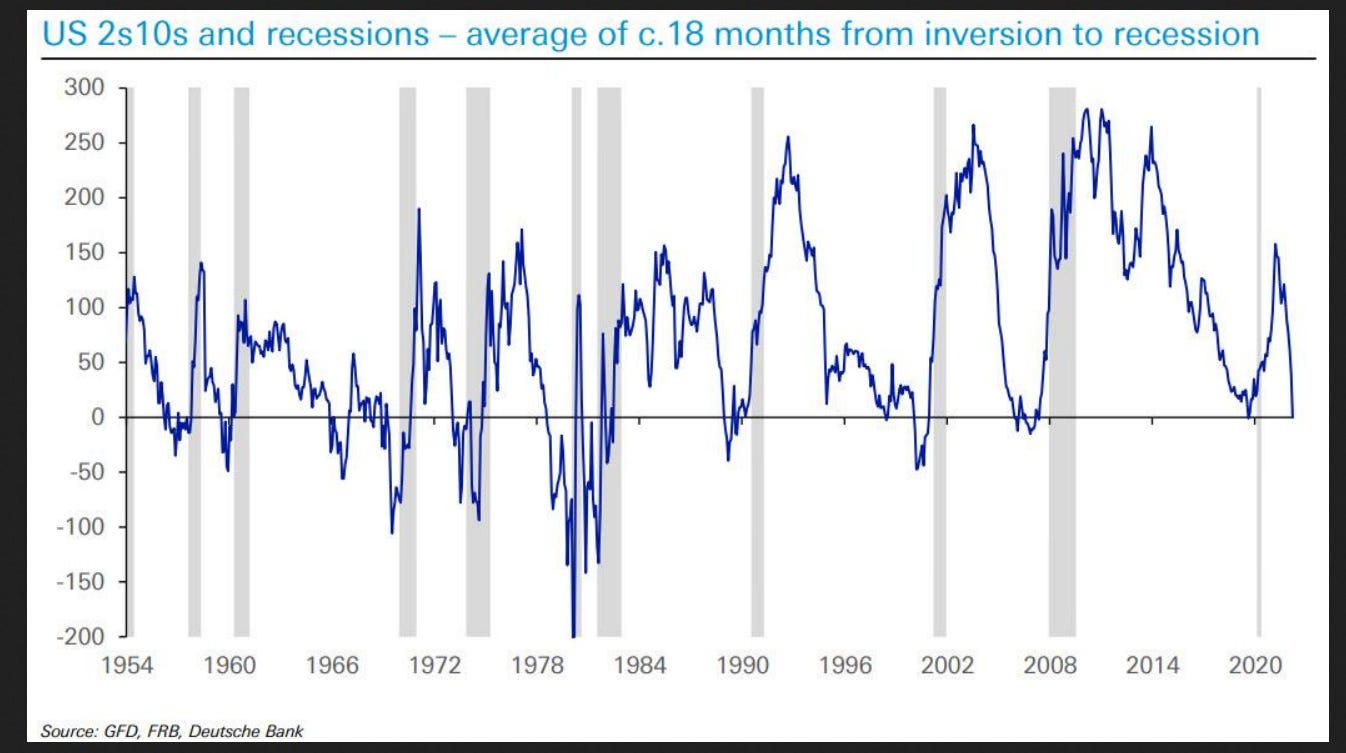
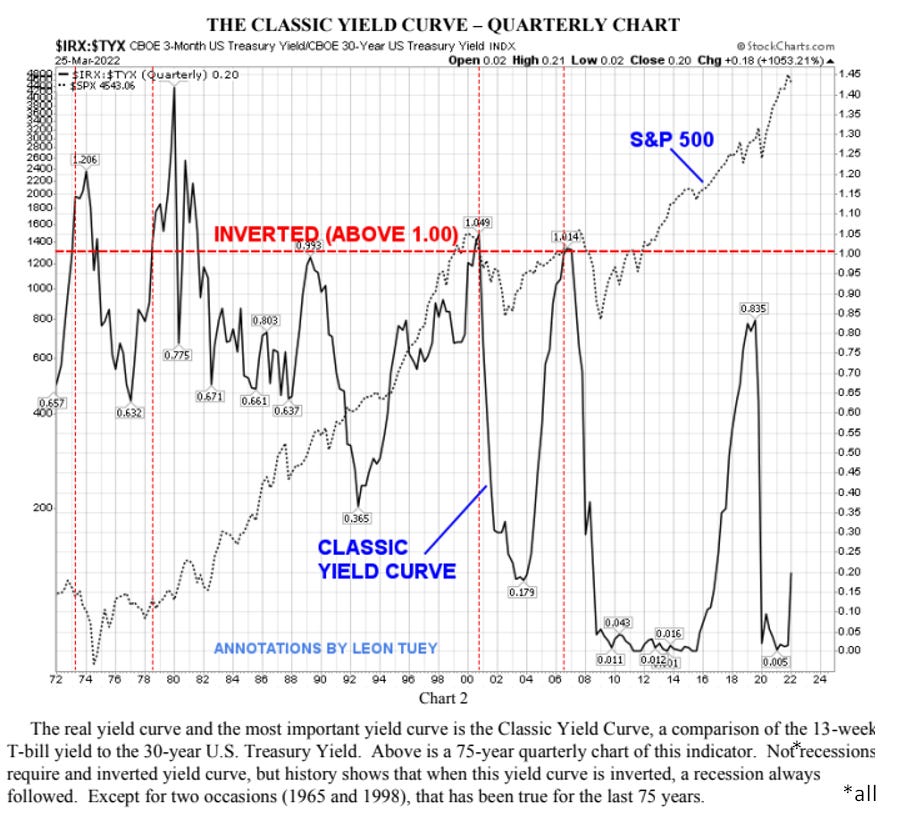
Not all recessions have inverted yield curves, but almost all inverted yield curves coincide with recessions over the last 75 years. The most reliable of these is the “classic” yield curve (pictured below) which compares the 13-week T-Bill to the 30-Year Treasury. – Source
But why does it mean that?
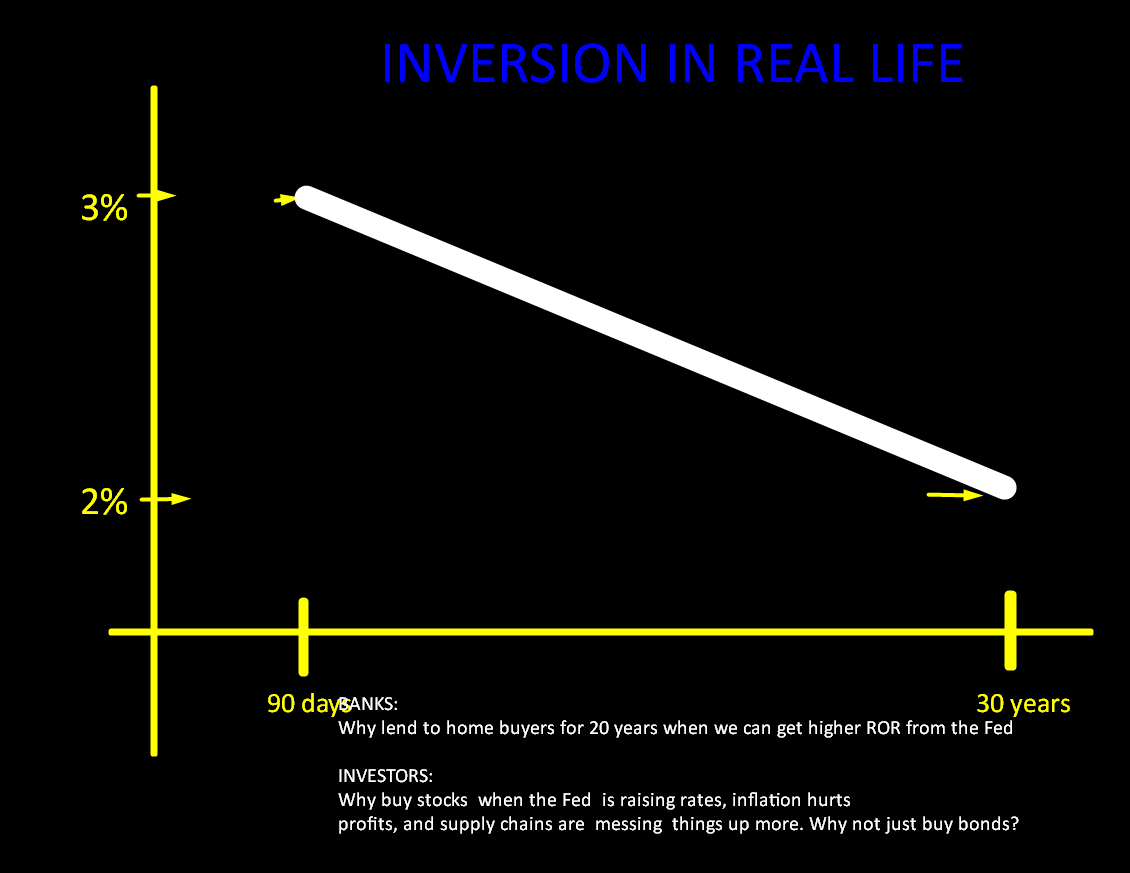
Inversion In Real Life
Here are 2 very, very, broad but unambiguously stated comments on what an inverted yield curve coupled with a decreasing stock market tells us.
- Go to cash
- Don’t make long term loans
GO TO CASH
Inverted yield curves (with declining stocks) are the investor market telling us: We are unsure about the future. Therefore we will buy long-term bonds instead of equities to be safe. And because rates are rising in the short term, some will keep more money in cash, especially because inflationary forces are still elevated.
DON’T MAKE LOANS
For Banks, an inverted yield curve says: Don’t make loans. You are potentially paying more out on money markets than you can get for a 20-year mortgage. Do not grow your loan/investment portfolio now. You can make more money in cash than by taking a long-term risk.
From that very real combination of entirely different segments of the financial world conducting business on different parts of the term structure, we get a confluence of events that frequently translates into a recession. The inverted yield curve is market behavior telling us this.
Inversion Is The Result, Not the Cause
If there is any reverse causality it is in interpreting yield curve inversion as a major contributing cause to a recession in any form, when in fact, yield curve inversion is largely a result of other 3 factors- inflation, rising rates, and geopolitical turmoil; all of which we have right now.
Restated: Inflation ( shrinking profit margins), rising rates ( less investment capital available), and war (misdirected resources, restricted trade) are recessionary. Inverted yield curves are the market taking those risks seriously. The yield curve is merely an abstraction of multiple real things happening.