Recent Bullish Flag Patterns in Tech Stocks Signal Potential Upside for Investors
Imagine watching a race car speed down the track, then slow down just a bit to take a sharp turn before gunning it again. That’s a lot like what happens in the stock market with something called a “flag pattern.” Let’s break down why this matters, especially if you’re thinking about your investments.
What Is a Flag Pattern?
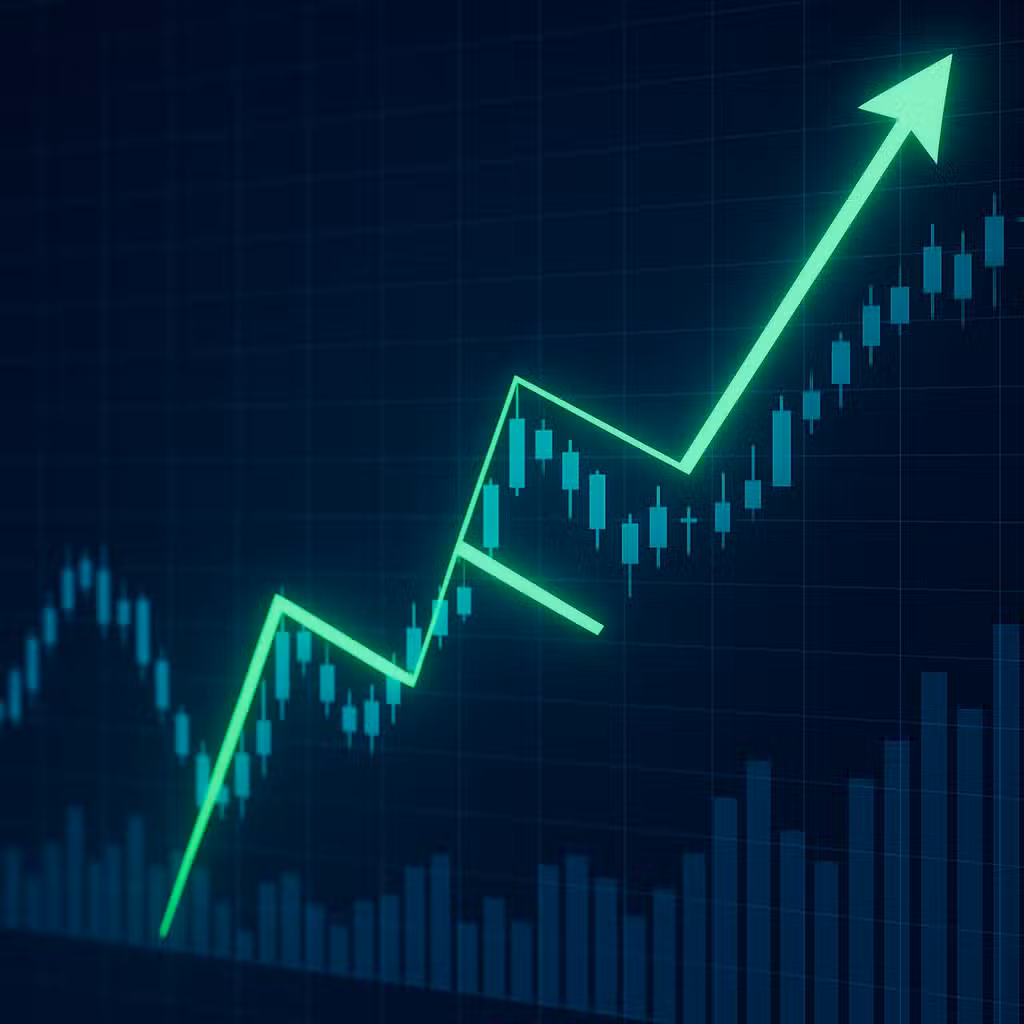
A flag pattern is like a pit stop for a fast-moving stock. After a big jump in price, the stock takes a short break, moving sideways for a while. This “rest” is the flag. When the stock starts moving up again, it often takes off quickly, just like a race car leaving the pit.
- Example: Zcash, a privacy coin, showed this pattern in April and May. After a big rise, it paused, then shot up again.
- Where to spot them: Technology and semiconductor stocks like Dell Technologies and Arm Holdings often show these patterns.
Why Investors Should Care
Flag patterns can be a sign of strong momentum. If you spot one, it might mean more gains are ahead. But it’s not a sure thing—markets can change fast. For investors, knowing about flag patterns can help you decide when to jump in or hold back.
- Upside: Flag breakouts are often followed by a “measured move”—the stock can rise by about the same amount as it did before the pause.
- Quick action needed: These moves can happen fast. For example, Arm Holdings saw a big jump in just three days after its flag breakout.
Bulls vs. Bears: The Debate
- Bull case (pros):
- Flag patterns show buyers are still interested—even after a big run-up.
- Stocks in strong uptrends, like many semiconductors, often see several flag breakouts in a row.
- According to a study by Investopedia, flag patterns have a higher success rate in strong bull markets.
- Bear case (cons):
- If the market changes, these patterns can fail quickly.
- Breakouts on low volume may not be reliable.
- Not every sideways move is a flag—sometimes it’s just the stock getting tired.
Historical Context
Flag patterns aren’t new. They’ve been used by traders for decades to spot quick opportunities. For example, during the tech boom of the late 1990s, flag patterns often signaled further gains in hot sectors like semiconductors. In fact, according to a 2020 study from the National Bureau of Economic Research, technical patterns like flags can help explain short-term price moves, especially in fast-moving markets.
What to Watch For
- Look for a sharp move up, followed by a tight, sideways “flag.”
- Watch for a breakout above the flag with higher-than-normal trading volume.
- Check if the sector is strong—flag patterns work best when the whole group is doing well.
Investor Takeaway
- Flag patterns can help spot stocks ready to make another move up, but they work best in strong markets.
- Act quickly if you see a breakout with strong volume—these moves don’t last long.
- Don’t rely on flag patterns alone. Use them with other research and watch for changes in market mood.
- Focus on sectors showing leadership, like technology and semiconductors, where flag patterns are more common.
- Remember, no pattern is perfect—keep your risk in check and don’t bet the farm on any single signal.
For the full original report, see CNBC