Some were stunned to see stocks surge in the last hour of trading on Friday in the illiquid vacuum that saw the S&P earlier tumble into a bear market, sliding more than 21% from its January all-time high (a level that equates with 3,855 in the e-mini) briefly before bouncing back above 3900, and rejecting the third attempt to enter a bear market in the past week.
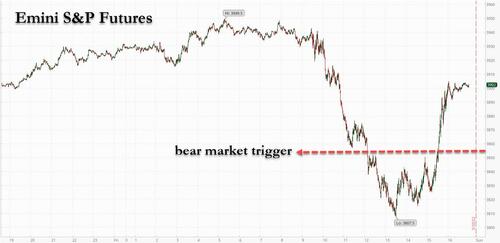
We were not, and the reason why is that as has been the case every time a short base builds up, there was a sharp short squeeze. And how did we know that enough of a short pile up had been built up to be toppled by even the smallest spike higher? Why the latest Goldman Prime Brokerage data (full report available to zh pro subscribers). Here are the highlights:
- US equities on the GS Prime book were net sold for the first time in 4 days driven by short sales and to a lesser extent long sales (2.5 to 1).
- Wednesday’s net selling on the Prime book, driven by short sales, was relatively modest (1-Year Z score -1.4) compared to the sharp market losses (SPX -4%, largest drop in nearly 2 years), suggesting that hedge funds collectively were not the main driver of the price declines; and also suggesting that they had been already substantially short heading into the -4% abyss.
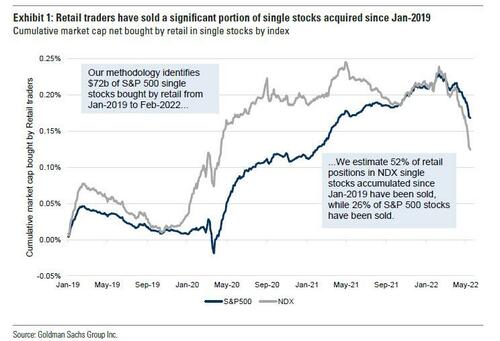
- At the same time, quantitative measures tracked by Goldman Research indicate retail investors have become sellers in the past few months, reversing ~26% of the cumulative positions net bought in SPX stocks since Jan ’19 (link ).
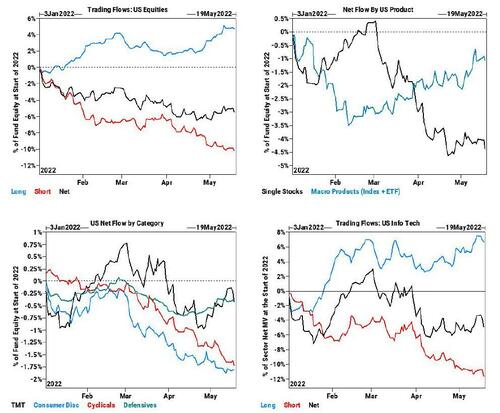
Looking at the composition of trades, Goldman Prime finds that both single stocks and macro products (Index and ETF combined) were net sold and made up 67% and 33% of the $ net selling, driven by short sales.
Furthermore, single stocks saw the largest $ net selling in the past month (1-Year Z score -1.4). 9 of 11 sectors were net sold led in $ terms by Info Tech, Comm Svcs, Industrials, Health Care, and Materials.
This is not to say that hedge funds refuse to take profits: indeed, Consumer Discretionary and Consumer Staples – the worst-performing sectors on Wednesday – were both modestly net bought on the Prime book, driven by long buys and short covers, respectively.
On the other hand, long-suffering Info Tech stocks were net sold for a second straight day – following 5 straight days of net buying from 5/10 to 5/16 – and saw the largest $ net selling in the past month (1-Year Z score -1.2), driven by short sales and to a lesser extent long sales (3.2 to 1)
But the easiest way to visualize the growing bearish sentiment is by looking at the red line in the top-left chart (US equities trading flows), which is now at the lowest level (most shorts) in 2022:
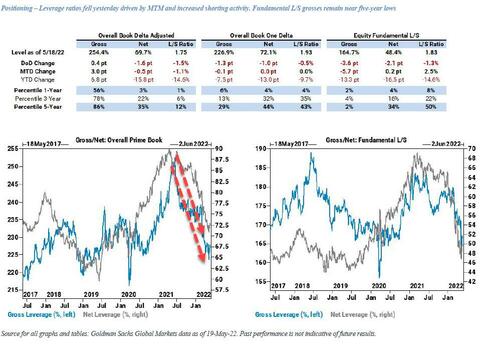
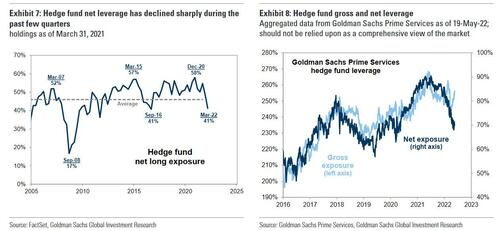
Ok, so we know that hedge funds have been piling up shorts (not to mention puts), which also explains the lack of a violent VIX surge or a capitulation lower in stocks. What may be just as notable is that despite the rise in short positions, both gross and net hedge fund exposures have collapsed. Indeed, the latest Goldman PB data reflects some of the largest reductions of leverage on record (more in the full latest Goldman prime broker weekly note available to pro subscribers).
According to Goldman’s Tony Pasquariello, the huge underperformance of implied volatility traces back to this point (which, he calls an “immense oddity” – over the past 15 years, there have been 36 daily selloffs of 4% or more, and the VIX was never as low as it was on Wednesday).
Finally, here are the five top highlights from the latest quarterly Hegde Fund Tracker report from Goldman (also available to professional zero hedge subs in the usual place):
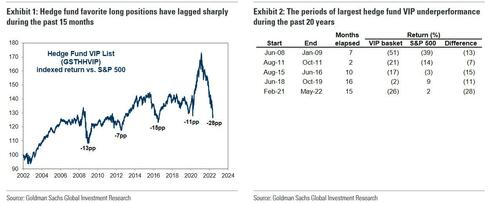
PERFORMANCE: Both alpha and beta have posed large headwinds to hedge fund returns so far in 2022. The worst start to a year for the S&P 500 since 1932 has created a challenging beta environment. In terms of alpha, Goldman’s Hedge Fund VIP basket of the most popular long positions (GSTHHVIP) has lagged the S&P 500 by 28 pp since early 2021, its worst stretch on record.
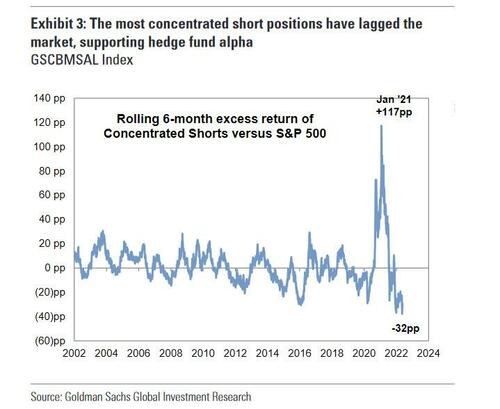
Funds have fared better with shorts; the most concentrated short positions are down 31% YTD, lagging both the S&P 500 and VIPs. Nonetheless, the median S&P 500 stock still carries short interest equivalent to just 1.5% of the market cap, a 25-year low.
LEVERAGE AND FLOWS: As noted above, the decline in hedge fund net leverage that began in 2021 has accelerated in recent months. Exposure data calculated by Goldman Sachs Prime Services show net leverage in the 30th percentile vs. the past 5 years compared with record highs in spring 2021.
Despite recent selling pressures, equity allocations across a number of investor groups – most notably households – still appear elevated, suggesting the potential for more selling pressure if the macro outlook does not become more friendly for equities.
HEDGE FUND VIPS: Despite the sell-off in technology stocks, FAAMG remains atop Goldman’s list of the most popular hedge fund long positions. MSFT maintains its position as #1. The VIP list contains the 50 stocks that appear most often among the top 10 holdings of fundamental hedge funds. Four new Energy stocks entered the basket (CHK, VAL, OXY, and LNG) and the sector now has a 10% weight.
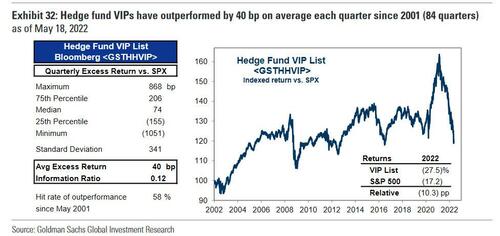
The basket has outperformed the S&P 500 in 58% of quarters since 2001 with an average quarterly excess return of 40 bp. 16 new constituents: ANTM, APO, ATVI, CHK, CHNG, CRWD, EQT, FIVN, GPN, HUM, MRVL, OXY, PLAN, T, VAL, Z.
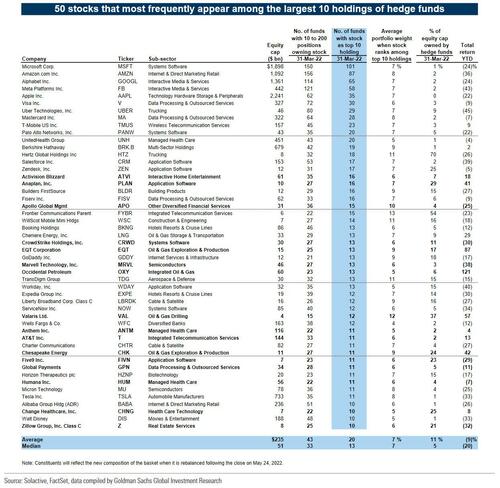
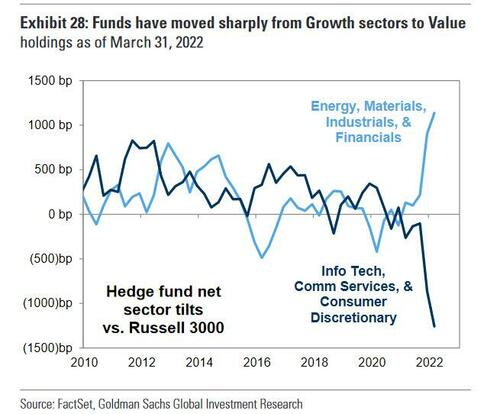
GROWTH STOCKS: Hedge funds continued to reduce exposures to the Growth sector and stocks. Rising real interest rates and declining leverage have weighed in particular on the valuations of long-duration stocks with extremely high multiples.
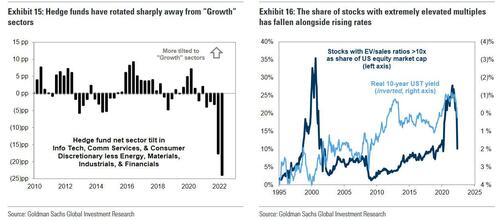
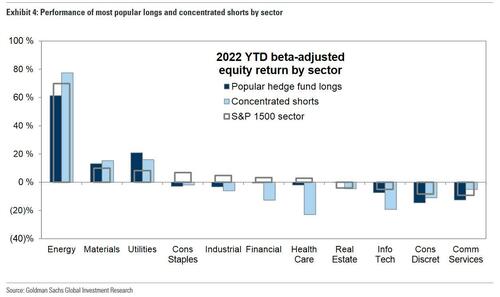
SECTORS: Hedge funds added to Industrials and Materials while cutting exposures to former favorite Growth sectors. Fund tilts to Information Technology and Consumer Discretionary are now at the lowest levels in at least a decade. “Big Tech” drove much of the reduction in positions across Tech and Discretionary, with funds incrementally rotating away from AAPL, AMZN, and TSLA.
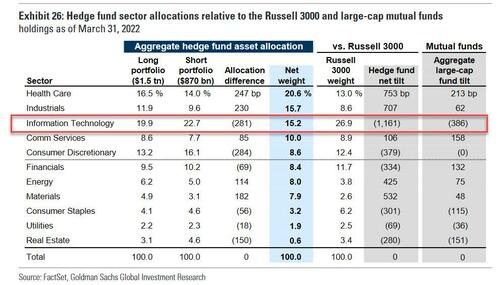
Putting it all together, Goldman’s Ben Snider summarizes that “a plummeting equity market and the even worse performance of the most popular long positions have led to the worst start of a year on record for hedge fund returns. HFR data show the average equity hedge has returned -9% YTD and GS Prime Services estimates an asset-weighted decline of -17%. As a result of these struggles, in recent months hedge funds have accelerated the reduction in leverage and rotation away from Growth stocks they began several quarters ago” while at the same time piling up shorts.
However, as Goldman notes, this adjustment has not been quick enough and despite four Energy stocks entering Goldman’s Hedge Fund VIP list of the most popular long positions (CHK, VAL, OXY, and LNG), Tech still represents over a third of the basket’s 50 constituents. The five FAAMG companies remain at the top of the list. The basket has declined by -27% YTD vs. -18% for the S&P 500 after underperforming the S&P 500 by 17 pp in 2021. During this period, hedge fund VIPs have effectively given back all the excess return they had generated since 2014.
Concluding, Goldman writes that the sharp recent reduction in hedge fund length and rotation in long portfolios reflects a broader asset reallocation taking place across the market. In recent years, low-interest rates have supported the investment philosophy that There Is No Alternative to equities (“TINA”). Long-duration Growth stocks have benefited most as both institutional and household investors lifted their equity exposures.
Today, in contrast, positive real interest rates, growing recession fears, and declining equity prices have signaled to investors that There Are Reasonable Alternatives to stocks (“TARA”). Investors have been reallocating accordingly. This ongoing adjustment is reflected in household and institutional flows away from equities broadly and from Growth stocks in particular.
For hedge funds, this has exacerbated the vicious cycle of falling share prices, declining leverage, and poor liquidity that has created such a challenging market environment this year.

