GameStop: Navigating the Chart Ahead of the Earnings Report
GameStop (GME) is once again capturing investors’ attention as they await its much-anticipated earnings report due after the market closes on Tuesday. This comes on the heels of renewed trading activity fueled by social media influencer Keith Gill, famously known as "Roaring Kitty." His recent endorsements of the stock have resulted in impressive gains, making GameStop a significant point of interest for traders and analysts alike.
Technical Trends and Key Price Levels
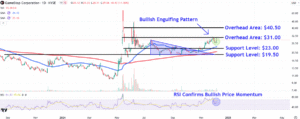
As of late October, GameStop’s shares have shown a remarkable upward trajectory following a breakout from a descending triangle formation. This bullish trend has been further solidified by the appearance of a bullish engulfing pattern after a minor pullback, fueled by above-average trading volume. Such patterns typically indicate potential upward momentum and could be a hallmark of the stock’s performance leading up to earnings reports.
Resistance Levels to Watch
Investors should keep a keen eye on critical overhead resistance levels at $31 and $40.50. The $31 mark aligns with a trendline connecting last month’s swing highs, alongside levels encountered during GameStop’s volatile trading phases in May and June. Should the stock manage to break decisively above this resistance, it could pave the way for a rally towards the more formidable $40.50 level, which many traders might view as an exit point for profits accrued from earlier lower-priced entries.
Support Levels: A Safety Net or a Warning Sign?
On the flip side, it’s essential to monitor key support levels, particularly the $23 mark. This level is significant as it has historically served as a pivotal point of interest, where buying opportunities may emerge based on multiple peaks and troughs established on the chart between May and October. A failure to maintain above this support could lead to a precarious situation, opening the gate for a further decline toward $19.50. This level is particularly noteworthy because it correlates with an important horizontal line that connects the September 2023 countertrend high with several swing lows from the previous months.
RSI: Indicating Positive Momentum
The relative strength index (RSI) reading currently exceeds 60, confirming positive price momentum without entering the overbought territory. This provides a crucial buffer for traders, indicating that there’s still room for upward movement before risking a correction.
Conclusion
As we approach GameStop’s earnings report, traders must brace for volatility driven by the upcoming release alongside the meme stock frenzy. Both resistance and support levels will play vital roles in how the stock performs in the days following the earnings announcement.
At Extreme Investor Network, our focus is to provide you with deeper insights that go beyond mere price predictions. We analyze market sentiment, company fundamentals, and innovative trading strategies to empower our investors with the knowledge they need to make informed decisions in today’s fast-paced market.
Stay with us as we continue to provide you unparalleled expertise and unique perspectives on investing in the emerging landscape of meme stocks and beyond.

