Supermicro Soars 30% Amid Resolved Accounting Concerns: What Investors Should Know
In a dramatic turn of events, shares of Super Micro Computer, Inc. (SMCI) surged nearly 30% last Monday after the company announced that an independent review had exonerated it of alleged accounting irregularities. This announcement serves not just as a relief to shareholders but also provides a fascinating case study on market dynamics and investor psychology.
The Roller Coaster Ride of Supermicro Stocks
Earlier this year, Supermicro faced a barrage of scrutiny and significant stock volatility, plummeting as much as 86% from its early-March peak. The accusations surrounding its accounting methods led to delayed financial filings and raised red flags about a potential delisting from Nasdaq, especially following the resignation of its auditor in October. However, the recent independent audit has helped to calm the storm, injecting new life into the stock and instigating a rally that has seen it more than double from last month’s low.
On the day of the announcement, Supermicro closed at $42, with an additional 4% uptick in after-hours trading, marking a significant recovery for a company that had briefly become the darling of the artificial intelligence sector.
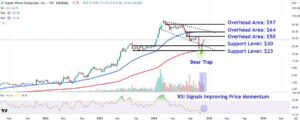
Technical Analysis: Key Levels to Watch
As Supermicro continues to regain momentum, it’s essential to break down the stock’s technical analysis for savvy investors.
-
Descending Broadening Formation
The stock has successfully reclaimed the lower trendline of a descending broadening formation—a technical pattern that typically signals increased volatility and can lead to price reversals. This shift is especially noteworthy as it follows a "bear trap" formation from last month, suggesting a bullish outlook for the future. -
Volume Uptrends
The recent price surge has been supported by above-average trading volumes, which is often a sign of institutional buying. This level of investor interest is crucial—an indication that larger players are confident in the rebound. - Relative Strength Index (RSI)
While the RSI remains below 50, it’s experienced a consistent rise, hinting at improved price momentum. This rising indicator could further attract buyers in the coming weeks.
Strategic Price Levels: Support and Resistance
For those considering an investment in Supermicro, keeping an eye on both overhead resistance and support levels is paramount:
-
Overhead Resistance Levels: The immediate resistance lies around $50, a psychological barrier that coincides with both early-August lows and late-October highs. If the stock pushes past this point, there’s potential for a rally towards $64, where it may encounter selling pressure due to its alignment with the 50-week moving average.
-
Targeting Higher Peaks: A remarkable price move could elevate SMCI towards the $97 mark, just below its March highs. Monitoring fluctuations in this area will be vital for capturing potential exit points and maximizing returns.
- Key Support Levels: On the retracement front, the first major support is around $30. This level corresponds with the top trendline of a consolidation period while slightly below the $23 mark, where the 200-week moving average rests. This lower level may serve as a critical support point should the stock face additional downward pressure.
Conclusion: Vigilance Required
While Supermicro’s recent performance offers an optimistic outlook, it’s essential for potential investors to remain vigilant. The stock’s trajectory will heavily depend on broader market conditions, ongoing operational performance, and sustained investor confidence in the company’s revamped accounting practices.
At Extreme Investor Network, we’re committed to providing you with the analytical insights you need to navigate the complex world of finance. Keep engaged with our content to stay ahead of market trends and insights that can help you make informed investment decisions.