Palantir Technologies: Market Movements and Technical Insights
Palantir Technologies (PLTR) is once again in the spotlight as its stock continues to experience volatility, retreating from the record high it achieved in late December. In premarket trading on Wednesday, shares of Palantir saw a decline, following yesterday’s sharp drop, as investors remain cautious amid recent market signals.
Recent Developments Impacting Palantir’s Shares
The downturn can largely be attributed to Morgan Stanley initiating coverage on Palantir with an "underweight" rating, a move that has rattled investor confidence. Additionally, the news that Cathie Wood’s ARK Investment Management tech funds have sold off shares has added to the selling pressure. Such strategic moves by influential investment firms can often sway market sentiment, leading to quick sell-offs or shifts in trading behavior.
Interestingly, despite being recognized for its significant role in the AI sector, fostering a fantastic surge in demand and becoming the best-performing stock in the S&P 500 for 2024, Palantir’s shares have now fallen approximately 18% from their all-time high of $83.21 reached on December 24.
Chart Analysis and Key Support/Resistance Levels
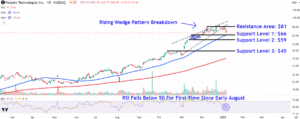
From a technical analysis perspective, Palantir’s stock experienced a breakdown from a rising wedge in late December, which is generally considered a bearish signal. As the stock retested the lower trendline of this pattern, fresh selling pressure emerged, although trading volumes have been surprisingly subdued.
To better understand the stock’s current positioning, we can identify some crucial support and resistance levels. Monitoring these can provide investors with insights into potential buying or selling opportunities.
-
Support Levels:
- $66: This key level has multiple layers of support; it aligns with the 50-day moving average and coincides with the 38.2% Fibonacci retracement from the late October low to the December high. This combined strength makes it an essential level for bulls to defend.
- $59: If the stock breaks below $66, the next potential support area is around $59. This level corresponds with a pennant pattern seen in mid-November, suggesting it could attract buyer interest.
- $45: A more significant correction could see shares retracing to $45, approximately 35% lower than recent close. Historical price actions reveal that this level previously experienced buying interest, indicated by twin peaks on the chart formed during October.
- Resistance Level:
- $81: If the stock begins to recover, keep an eye on the $81 mark, where significant selling pressure may re-emerge. This region includes several peaks located just beneath the stock’s all-time high, making it a potentially critical resistance level.
Conclusion: What to Watch For
Investors in Palantir should keep a close watch on these technical levels—particularly the support at $66 and the resistance at $81. The relative strength index (RSI) indicators also suggest a weakening price momentum, having dipped below a critical threshold of 50 for the first time since early August, which may signal a slower recovery ahead.
In the ever-evolving landscape of tech stocks, tools such as comprehensive chart analysis, market sentiment monitoring, and understanding the larger economic context can provide invaluable insights for investors looking to navigate the complexities of the stock market.
For more in-depth insights and unique analyses on stocks like Palantir, stay connected with the Extreme Investor Network as we continue to explore the ever-shifting finance landscape!

