The price of silver has been going down, and then down some more. From over $28 a year ago and over $26.50 a month ago, it’s now at a new low under $22.50. Four bucks down in a month.
However, it’s been behaving differently than gold behind the scenes. Let’s look at the gold and silver basis charts to see.
Gold Fundamentals – Gold Basis Analysis
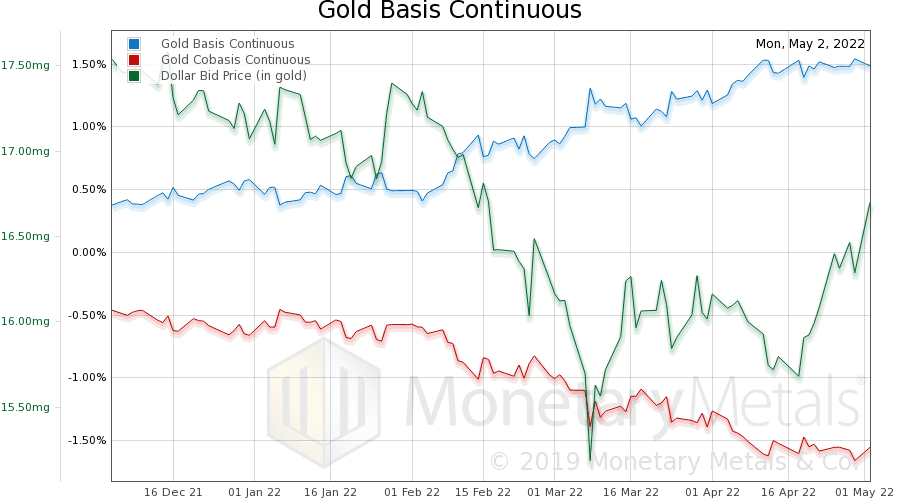
The gold basis (i.e. abundance to the market) was humming along at around 0.5%. Then, as the price began to rise, it rose also, now around 1.5%. Gold would seem to be more abundant, first with a higher price (inverse to the price of the dollar, as measured in gold, indicated on the chart). Now, the gold basis is showing that it still looks abundant, even at a lower price.
Now, look at silver.
Silver Fundamentals – Silver Basis Analysis
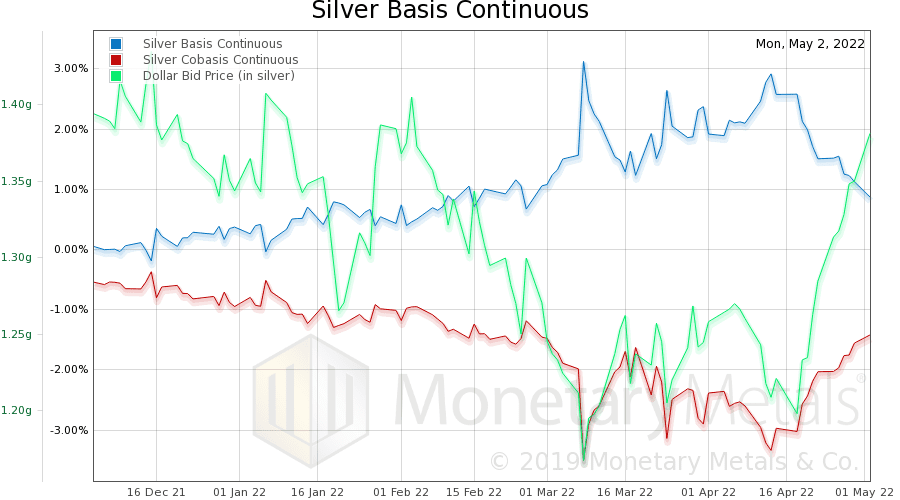
The silver basis also rises around the same time. But, it has fallen back to around the same level as before, under 1%.
We said gold “would seem” to be more abundant. However, something else changed during this time. The Fed hiked interest rates. The Fed does not control LIBOR (the London Inter-Bank Offered Rate), but LIBOR tends to go with the Fed Funds Rate. And LIBOR went up a lot—from around 0.3% to around 1.3%.
Recall that the basis is set by the marginal arbitrager, who carries gold. Speculators bid up futures contracts. Then the arbitragers borrow (at LIBOR), buy gold metal, and sell futures. They do this to make a small spread. If the interest rate is higher, they don’t make a profit unless the basis spread is wider.
The gold basis is not up as much as LIBOR. The silver basis is even more telling.
Comparing Precious Metal Fundamentals
Let’s look at (one-year) graphs of the Monetary Metals’ fundamental prices of both metals.
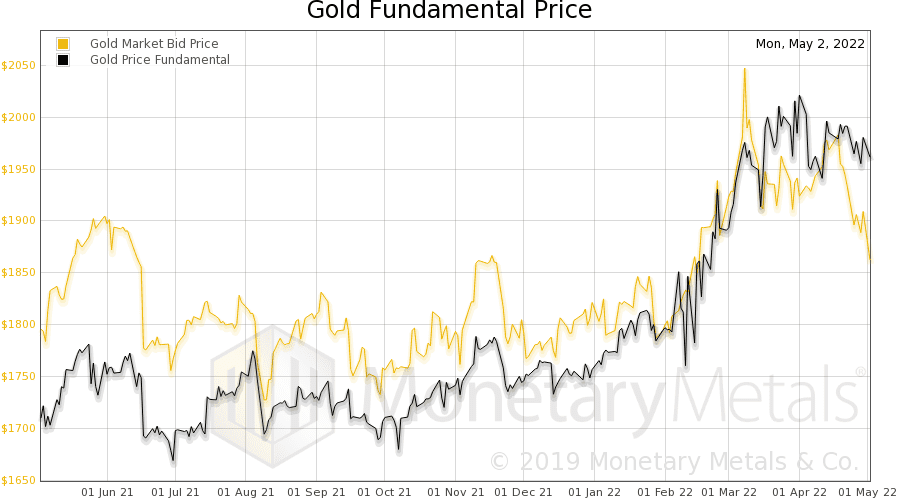
The fundamental price (black line) is only down a hair from its high last month, and still near $2,000.
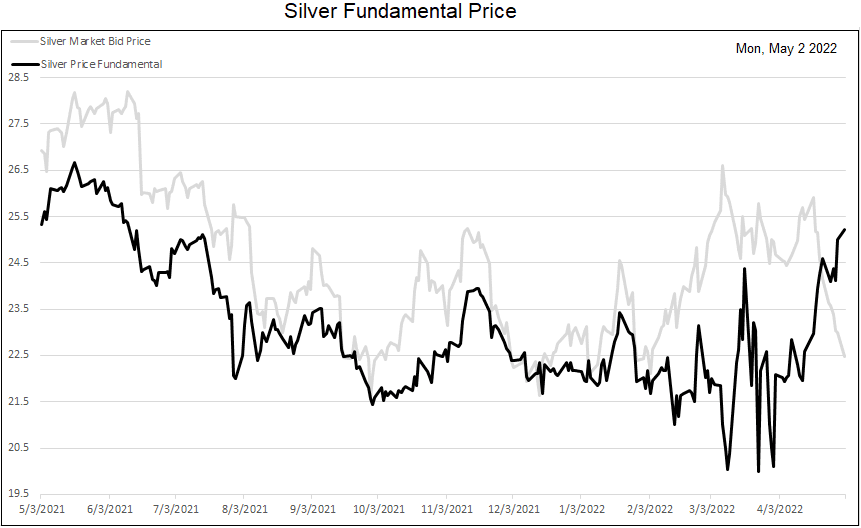
The silver fundamental is up considerably from recent levels, and nearly to where it was a year ago—well over $25.
So, Is It a Good Time for a Silver Trade?
Let’s look at one other chart. This is the ratio of the gold basis to the silver basis and the ratio of the gold cobasis to the silver cobasis.
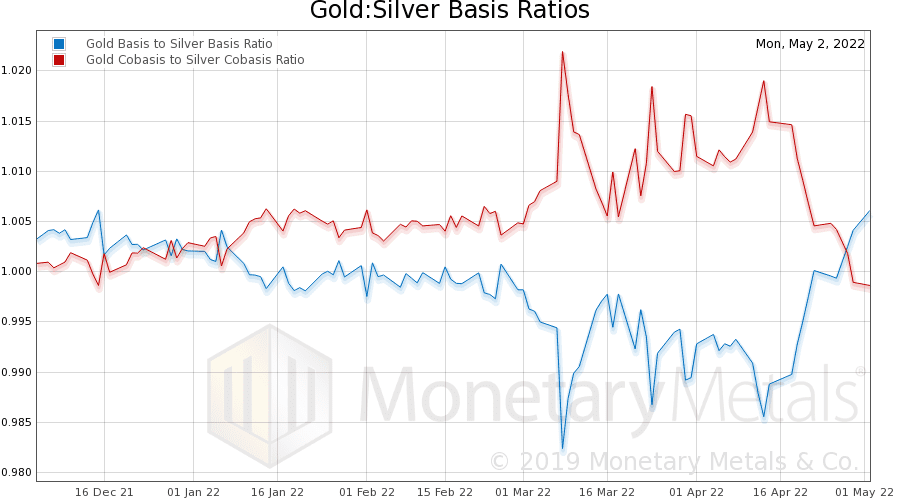
When the red line is above the blue line, gold is the scarcer metal in the market. Now, this has flipped, and the spread is wider than it’s been in years.
This may be a good time for a silver trade. Not only are the fundamentals looking better for silver relative to gold, but the gold-silver ratio is over 82.