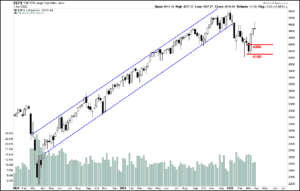
The S&P 500 would have to climb above 4300 to even hint at a change in the stock market’s downtrend
The S&P 500 index is trying to put a short-term bottom in place, and it looks like it might succeed.
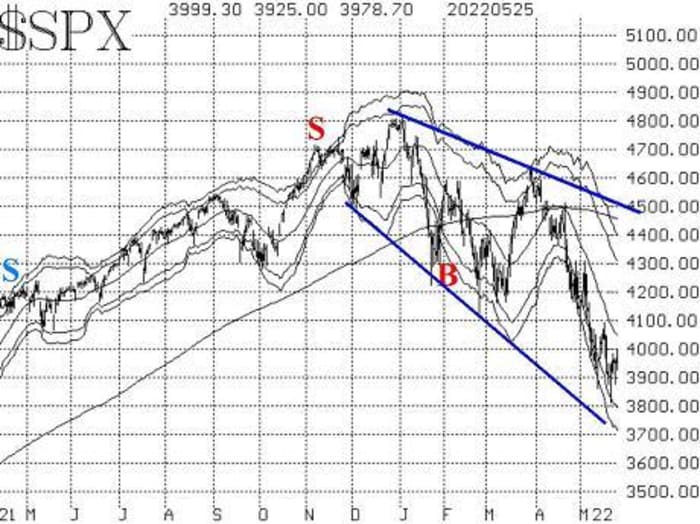
Still, this would not be the end of the bear market, in my opinion. I say that because the S&P SPX, 1.44% chart is still in a downtrend. New lows were made this past week, so the pattern of lower highs and lower lows is still intact. By definition, that is a downtrend for SPX. The index would have to climb above resistance at 4300 to even hint at a trend change.
Meanwhile, a short-term oversold rally is unfolding, which should be able to reach somewhere on the upside between the declining 20-day moving average (4050) and resistance at 4160. The oversold rally in late March, though, far exceeded those norms – rallying all the way to the upper “modified Bollinger Bands.”
As for the downside, the most recent probes downward found support in the 3800-3870 range. There should also be support near 3700, which was the low in both January and February 2021.
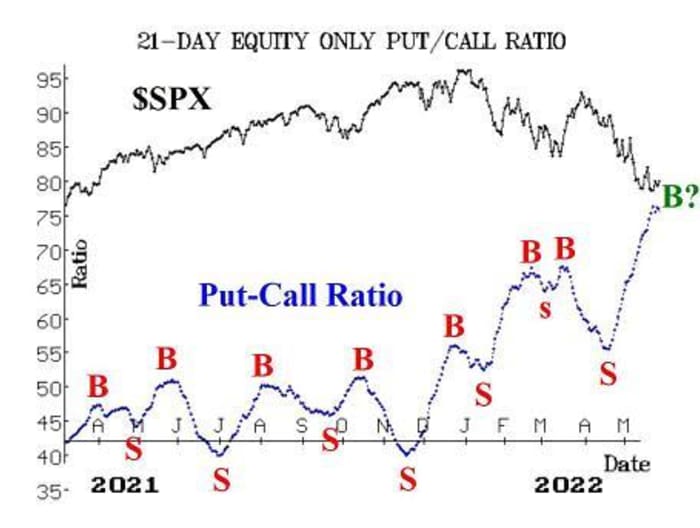
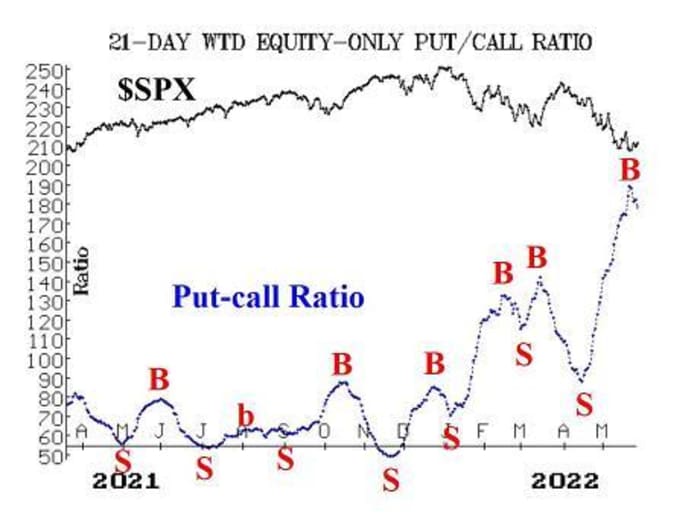
Equity-only put-call ratios have generated buy signals, at least according to the computer programs that we use to analyze them. In addition, the weighted ratio’s chart has rolled over to the naked eye, confirming the buy signal. The standard ratio is less obvious, but it appears to have rolled over as well.
These buy signals are coming from very high levels on their charts, meaning they had gotten extremely oversold – reflecting a lot of bearish opinions. That should make these strong, contrarian buy signals. They would be stopped if the ratios moved to new relative highs.
Breadth has improved, too, and the breadth oscillators first gave buy signals on May 20. After some shaky action early this week, they have confirmed those buy signals. These are short-term indicators, so they can reverse quickly, but this is the first breadth buy signal that has survived more than two days since the one in the second half of March (which was quite successful).
There has been improvement in the data of new 52-week highs vs. new 52-week lows, but it is still bearish at this point.
The number of new lows has fallen dramatically, but that alone does not constitute a buy signal. We would need to see new highs exceed new lows and for new highs to be at least 100 in number. We use NYSE for that purpose, and a buy signal has not yet occurred.
On Wednesday, there were 47 new highs and 82 new lows on the NYSE. The NASDAQ and “stocks only” data were much worse than that. So at this point, we still don’t have an NYSE-based buy signal from this indicator.
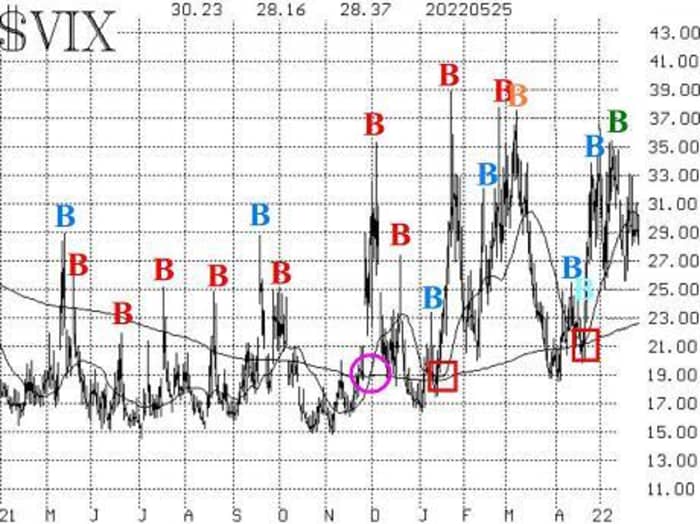
VIX VIX, -3.00% has continued to languish near 30, never really spiking much higher on this last probe downward by the broad stock market. As a result, the VIX “spike peak” buy signal from May 11 is still in place (there was an additional, overlapping “spike peak” buy signal on May 19 as well).
The negative part about the VIX chart, though, is that both VIX and its 20-day moving average are still well above the 200-day moving average (which is just below 23 and rising). This means that the VIX trend is still upward, and that is an intermediate-term negative for stocks.
VIX would have to fall below the 200-day moving average in order to turn this indicator neutral (but that alone would still not be a buy signal from this indicator). This negative trend has been in force since late last November (pink circle on the accompanying VIX chart). A couple of times, the trend returned to neutral status (red boxes on the chart), but quickly went back to negative when VIX crossed back above the 200-day MA.
The construct of volatility derivatives remains neutral. The term structure of the VIX futures is fairly flat between July and October, and the term structure of the CBOE Volatility Indices is mixed as well. The slightly bullish piece of data is that June VIX futures (the front month) continue to trade lower than the price of July VIX futures. If that were to invert, it would be bearish.
In summary, the trends of SPX (down) and VIX (up) are still in place, and that is an intermediate worry for the stock market. But recent oversold conditions have now generated confirmed buy signals, so we are going to trade those around the “core” bearish position.
New recommendation: SPY bull spread
Based on the combination of new equity-only put-call ratio buy signals and breadth buy signals, we are going to add these SPY call bull spreads:
Buy 2 SPY July (1st) at-the-money calls
And sell 2 SPY July (1st) calls with a striking price 15 points higher
We will keep this position in place as long as both of the indicators remain on buy signals. If either one falls back to a sell, we will exit half this position. If they both revert to selling, this position will be closed.
New recommendation: Potential buy signal
We continue to keep this recommendation open. In a weekly newsletter, it is difficult to lay out all the possibilities, especially in an extremely volatile market such as this one. But this recommendation’s conditions are easy to track, so we will go with a potential buy signal from the new highs vs. new lows indicator:
IF NYSE new highs outnumber NYSE new lows for two consecutive days,
And IF new highs are at least 100 in number of both of those days,
THEN
Buy 1 SPY Jun (24th) at-the-money call
And sell 1 SPY Jun (24th) call with a striking price 13 points higher.
If the trade is established, then stop yourself out if new lows outnumber new highs for two consecutive days.
New recommendation: Electronic Arts
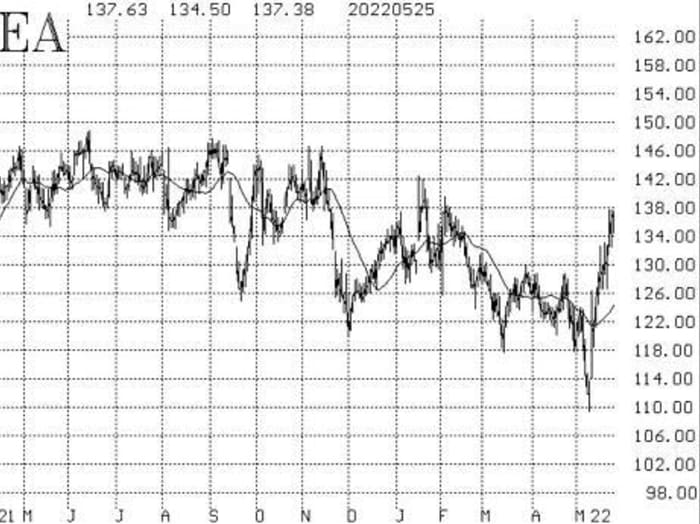
Electronic Arts Inc (EA) options volume has been heavy, relative to average option volume levels as takeover speculation has intensified. Stock volume patterns are strongly positive and improving. There is support at 126.
Buy 2 EA June (17th) 137 calls at a price of 5.00 or less.
We will hold without a stop for now.
Follow-up action
All stops are mental closing stops unless otherwise noted.
We are going to implement a “standard” rolling procedure for our SPY spreads: in any vertical bull or bear spread, if the underlying hits the short strike, then roll the entire spread. That would be rolling up in the case of a call bull spread, or roll down in the case of a bear put spread. Stay in the same expiration, and keep the distance between the strikes the same unless otherwise instructed.
Long 2 SPY June (17th) 389 puts and short 2 SPY June (17th) 364 puts: We originally bought this spread in line with the sell signal from the VIX trend. It was rolled down when SPY traded at 401 on May 9 and then rolled down and out at May expiration. This is our “core” bearish position. We will stop this position out if VIX falls below its 200-day moving average, which is currently rising toward 23.
Long 0 MAT calls: This position was stopped out when Mattel MAT, 4.79% closed below 24 on May 19.
Long 1 SPY June (17th) 392 call and short 1 June (17th) 412 calls: VIX confirmed a “spike peak” buy signal at the close of trading on May 12, and we bought this spread. Stop yourself out on a VIX close above 31.77 – the VIX closing price on the day the signal was confirmed.
Long 3 BKI June (17th) 70 calls: Continue to hold while the spread in this deal remains wide. The deal is 63.20 + 0.2 * ICE, which is worth $82.70 with ICE trading at 97.52. Black Knight BKI, 0.32% is trading at 69.35, which is still very widespread.
Long 5 MX Jun (17th) 20 calls: Continue to hold while the rumors play out.

