High inflation threatens to end a decade of improving profitability for U.S. companies, but these companies are bucking the trend
Decades of deflationary forces that helped feed booming prices for U.S. stocks are over, at least for now.
But some companies are countering the trend, by a combination of holding down expenses and raising prices for their products and services.
A list of 16 of these companies is below.
Earnings challenge:
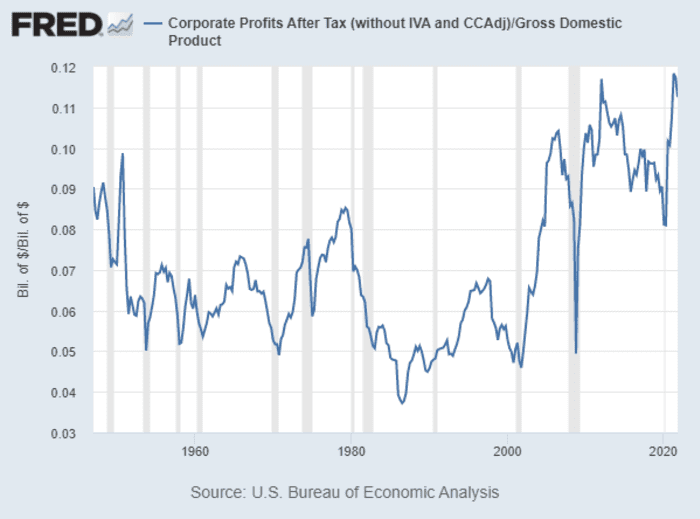
Before looking at that stock screen of the companies, check out this chart from the Federal Reserve Bank of St. Louis, showing U.S. corporate profits, relative to gross domestic product, from the beginning of 1947 through Oct. 1, 2020:
During a recent interview, Kimball Brooker, a portfolio manager at First Eagle Investments in New York, said this success came “to a degree, at the expense of labor.”
Brooker went on to say that recent successes in unionization efforts at Starbucks Corp. SBUX stores and an Amazon.com Inc. AMZN distribution center “are indicative of a shift, where labor’s real wages may not have kept up.”
With large increases in wages at a time of high inflation for supply costs, the ability to raise prices is critically important for companies to maintain profit margins.
Consumer inflation hit a new 40-year high of 8.5% in March, while wholesale prices were up 11.2% from a year earlier.
Brooker said corporate gross margins can “give us a clue about the flexibility of a business. The gross margin mainly reflects the direct costs. The higher the margin, the more flexibility a business has to compete and remain reasonably profitable in an absolute sense.”
A company’s gross margin is its net sales, less the cost of goods or services sold, divided by sales. Net sales are sales minus returns and discounts, such as coupons. The cost of goods or services sold includes the actual costs for making the items or providing the services, including labor. It is a useful measurement of pricing power, and a combination of an expanding gross margin and increasing sales is a good sign.
Other expenses are captured in pre-tax operating margins.
Brooker said a company’s ability to raise prices to cover rising costs might indicate that there are few substitutes for its products or services, or that it has a special competitive advantage.
“The fewer the substitutes, the better the pricing power,” he said.
Pricing-power screen
Understanding pricing power is complicated. Higher prices may reflect an increase in the price of a commodity, such as oil, as production break-even points are left behind. Then again, oil doesn’t dominate the results of the following screen, which is designed to narrow a list of companies that have increased sales while improving profit margins, all the while not diluting shareholders’ ownership positions.
Starting with the S&P 500 SPX, we narrowed the list to companies that met the following criteria, based on data provided by FactSet:
- Higher operating income before unusual items for the most recently reported quarter from the year-earlier quarter, from data available at the end of April 13. Any company will have certain costs that are fixed, even within the gross margin. So an increase in sales past a critical level can lead to large increases in operating income.
- Higher sales for the most recently reported quarter from the year-earlier quarter.
- Expanded gross margin. If we look at this element alone, it is available for 447 of the S&P 500. Gross margins aren’t available for banks and insurance companies, which use different measures of profitability. So those industries are excluded from the screen. Among the 447 companies, 225 (or 50%) of the companies had improved quarterly gross margins year-over-year.
- Expanded operating margin.
- A decline in the average share count used to calculate quarterly earnings, from the year-earlier quarter. Raising the share count dilutes the ownership position of shareholders and decreases their portion of a company’s earnings and cash flow. Among the S&P 500, 269 (or 54%) of companies had lower average share counts for the most recent quarter from the year-earlier quarter.
Here are the 16 companies in the S&P 500 that showed the largest increases in quarterly operating income from a year earlier, while meeting the other screen criteria:
| Company | Ticker | Increase in op. income | Quarterly op. income ($mil) | Op. income – year-earlier quarter ($mil) | Quarterly gross margin | Gross margin – year-earlier quarter | Quarterly op. margin | Op. margin – year-earlier quarter | Increase in quarterly sales from year-earlier quarter |
| APA Corp. | APA | 617% | $846 | $118 | 45.15% | 18.62% | 53.76% | 49.96% | 89% |
| Raytheon Technologies Corp. | RTX | 563% | $1,234 | $186 | 20.16% | 13.46% | 13.95% | 8.16% | 4% |
| Nucor Corp. | NUE | 436% | $3,029 | $565 | 34.07% | 13.67% | 31.55% | 14.48% | 97% |
| Mosaic Co. | MOS | 276% | $1,043 | $278 | 30.37% | 15.81% | 33.22% | 20.48% | 56% |
| Franklin Resources Inc. | BEN | 270% | $641 | $173 | 73.74% | 65.42% | 32.07% | 14.92% | 33% |
| Micron Technology Inc. | MU | 230% | $2,621 | $794 | 47.21% | 26.44% | 56.04% | 37.57% | 25% |
| Bristol-Myers Squibb Co. | BMY | 206% | $2,234 | $731 | 60.02% | 56.37% | 40.64% | 31.32% | 8% |
| Boston Scientific Corp. | BSX | 163% | $457 | $174 | 62.07% | 55.43% | 23.89% | 17.10% | 15% |
| PVH Corp. | PVH | 144% | $207 | $85 | 58.41% | 56.95% | 11.82% | 8.16% | 16% |
| Celanese Corp. | CE | 141% | $516 | $214 | 31.16% | 23.32% | 26.77% | 19.17% | 43% |
| Robert Half International Inc. | RHI | 124% | $199 | $89 | 39.06% | 38.26% | 14.23% | 8.00% | 36% |
| Prologis Inc. | PLD | 122% | $498 | $225 | 46.00% | 36.30% | 70.09% | 57.76% | 15% |
| Expeditors International of Washington Inc. | EXPD | 121% | $624 | $282 | 13.85% | 12.98% | 11.79% | 9.94% | 81% |
| Darden Restaurants Inc. | DRI | 114% | $292 | $136 | 16.57% | 14.39% | 15.79% | 12.96% | 41% |
| Dow Inc. | DOW | 112% | $1,807 | $851 | 17.18% | 13.76% | 17.14% | 14.10% | 34% |
| Advanced Micro Devices Inc. | AMD | 108% | $1,212 | $584 | 50.27% | 44.73% | 27.89% | 21.12% | 49% |
| Source: FactSet |
Click on the tickers for more about each company.