High inflation has captured the headlines as of late particularly as CPI recently hit the highest levels since 1981. Some are even suggesting we will face hyperinflation. However, while inflation is certainly present, the question to be answered is whether it will remain that way, or if the worst may already be behind us?
To answer that question, let’s define the difference between an inflationary increase and hyperinflation.
“Inflation is always and everywhere a monetary phenomenon. It is always and everywhere a result of too much money, of a more rapid increase of money, than of output. Moreover, in the modern era, the important next step is to recognize that today the governments control the quantity of money so that, as a result, inflation in the United States is made in Washington and nowhere else.“
Milton Friedman’s statement is backed up by the chart below of the M2 money supply compared to inflation (with a 9-month lag).
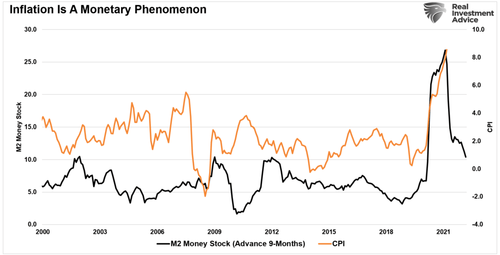
So, where did that surge in the money supply come from? Massive government bailout programs sent money directly to households that far exceeded economic activity. With production shutdown, demand dwarfed supply.
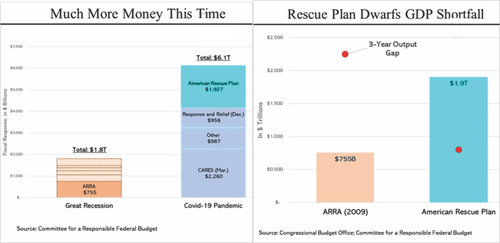
However, what we are experiencing is high inflation. “Hyperinflation” is not a threat. At least not yet.
“Hyper-inflation comes from a complete loss of faith in a currency from the threat of losing a war (Weimer Republic), an economic collapse, or some other catastrophic event. The U.S., even with all of our economic ills and woes, is still the safest place, in terms of liquidity, depth, and strength, to store excess reserves. The near historic low yield on government treasuries tells the story here.” – Real Investment Show
With that understanding, we can now examine what comes next in terms of high inflation.
The Peak Of Inflation May Be In
When discussing the inflation rate it is critical to remember that we measure the “rate of inflation” on an annualized basis. In other words, compare the current level of inflation index to the index level 12-months prior. That calculation provides the annual “rate,” or rate of change, in the consumer price index.
With the latest read of the inflation index, the annual rate of change was 8.2%. Here is where it gets interesting. If we assume that homeowners’ equivalent rent, food, gasoline, energy, and healthcare costs all remain at the current elevated rate into 2023, inflation will fall back to 2%. Such is because as we move forward, the inflation index will be calculated against rising index levels. The result will be lower levels of the “inflation rate” even though the cost of goods and services had no change in price.
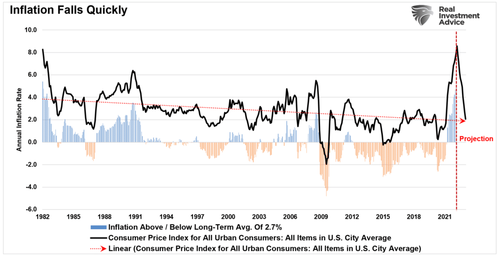
While that seems confusing, it is just a function of the underlying math.
Evidence Of Disinflation
However, the decline in the inflation rate may be substantially more prominent as the Federal Reserve begins its rate hike campaign and reduction of its balance sheet. Already, higher interest rates are slowing the housing market, and high prices are creating demand destruction. Already, consumer confidence is dropping sharply as expectations for consumers are collapsing.
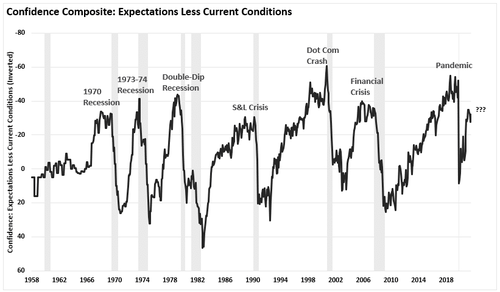
Of course, that lack of confidence leads to decisions to consume less as the cost of living increases outstrip wage growth. The decline in demand is showing up in the Cass Freight Index.

As Bloomberg’s Simon White writes, real economic activity in the U.S. is slowing sharply, and:
“This is showing up in lower demand for new trucks and autos, and a tailing off in freight volumes, leaving transport stocks facing more downside.”
Not surprisingly, heavy truck sales in the U.S. are, as Simon notes, a
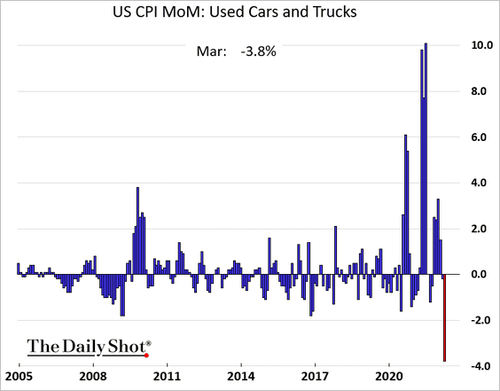
“Very good leading indicator of economic activity, with 65% of the dollar value of North American freight moved by trucks. But new truck sales have been falling sharply, now at -23% on an annual basis. New auto sales are falling at a similar rate. Truck and auto sales combined are falling at a rate previously only associated with recessions.
As shown in the latest CPI report, auto sales are indeed dropping sharply.
Deflation Likely A Bigger Issue For The Fed
The surge in “artificial inflation,” from the flood of liquidity against a supply shortage, will revert to a disinflationary trend. Debt and demographics will continue to drive deflationary pressures leading to a reversal of the inflation trade.
As the fear of inflation rose, investors piled into the commodity trade. While commodity prices rose due to the supply shortage, the reversal of that liquidity will undermine those assets. (Commodity prices track interest rates)
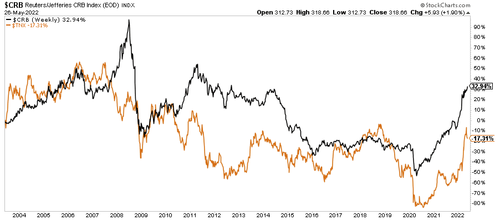
As we showed recently, the reversal in commodity prices will worsen if the Fed proceeds with its monetary tightening.
“Historically, when the Fed hikes rates or tapers its balance sheet, oil prices decline from slower growth and deflationary pressures.” – Real Investment Report 01-21-22
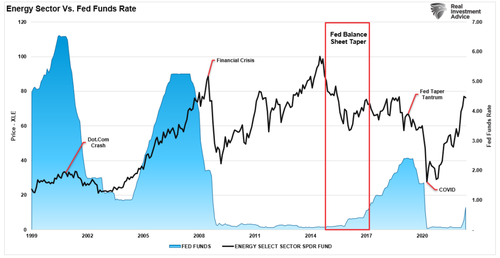
Many continue to compare the current economic environment to the 1970’s inflationary spike. However, the impact of demographics and debt are vastly different.
Throughout 2022, disinflation will likely be the most significant threat to the markets and economy. Such was the point in early 2021 in “Sugar Rush.”
Unless the Government remains committed to a continuous stimulus, once the “sugar rush” fades, the economy will “crash” back to its organic state.
The bottom line is that America can’t grow its way back to prosperity on the back of social assistance. The average American is fighting to make ends meet as their living cost rises while wage growth remains stagnant.
The 3-Ds suggest inflation will give way to deflation, economic strength will weaken, and over-zealous investors will once again get left holding the bag.

