
Did Goldman Sachs destroy a persistent myth about investing in stocks? Sam Ro recently suggested such was the case for the “sacred CAPE ratio.”
So, what is the persistent myth that is no more?
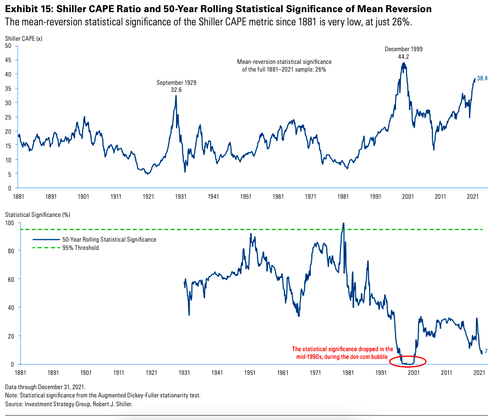
“While valuations feature importantly in our toolbox to estimate forward equity returns, we should dispel an oft-repeated myth that equity valuations are mean-reverting.” – Goldman Sachs
As Sam notes in his commentary,
“Many market watchers use above-average CAPE readings as a signal that stocks should underperform or even fall as it reverts back to its long-term mean. But CAPE’s mean doesn’t actually have much pull.“
However, here is the key sentence from Goldman’s analysis.
“We have not found any statistical evidence of mean reversion,” the Goldman Sachs analysts wrote. “Equity valuations are a bounded time series: there is some upper bound since valuations cannot reach infinity, and there is a lower bound since valuations cannot go below zero. However, having upper and lower bounds does not imply valuations are stationary and revert to the same long-term mean.”
While the analysis is correct, it obfuscates the more important point of valuations and reversions to the mean.
The Mean Has Moved
During extended bull markets, rationalization becomes commonplace to justify overpaying for value. One such rationalization is the permanent shift in valuations higher due to changes in accounting rules, share buybacks, and greater adoption by the public of investing (aka ETFs.)
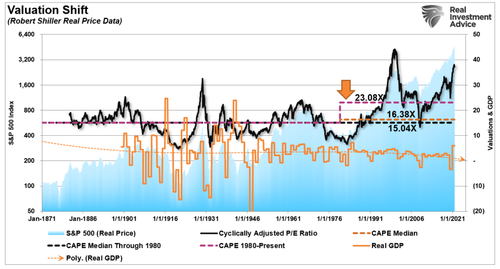
The chart shows the apparent shift in valuations.
- The long-term “median” CAPE is 16.38 times earnings from 1871-Present (all-years)
- The “median” CAPE ratio is 15.04 times earnings from 1871-1980.
- The “median” CAPE is 23.08 times earnings from 1980-Present.
There are two critical things to consider concerning the shift higher in valuations from 1980-Present.
- The shift higher in MEDIAN valuations was a function of falling economic growth and deflationary pressures; and,
- Increasing levels of leverage and debt, which eroded economic growth, facilitated higher prices.
Read “The Permanent Shift In Valuations” for a more detailed explanation.
However, here is the crucial point on valuations, slower economic growth, and debt from Crestmont Capital.
“However, as real economic growth significantly declined over the past two decades, it triggered a series of adjustments that represent the forces behind The Big Shift. Most importantly, the downshift in real economic growth disrupted the financial relationship of profits, future growth, and market value.
Slower growth drives P/E downward for similar reasons that it drives EPS upward.”
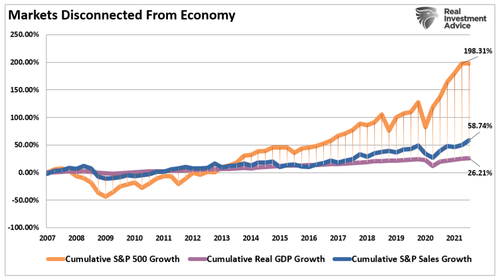
Of course, since the “Financial Crisis” lows, much of the rise in “profitability” has come from cost-cutting measures and accounting gimmicks rather than actual increases in top-line revenue. The stock market has returned almost 200% since the 2007 peak, which is more than 7-times the GDP growth and nearly 3.5-times the increase in corporate revenue. (I have used SALES growth in the chart below as it is what happens at the top line of income statements and is not AS subject to manipulation.)
Valuations ARE Mean Reverting
Of course, the surge in the stock market, and valuations, are a function of an $8 trillion-plus increase in the Fed’s balance sheet, several trillion in stock buybacks, tax cuts, and a massive surge in Government liquidity and debt. With price-to-sales ratios eclipsing 3x, a historical record, and median stock valuations near the highest in history, one should question the ability to continue borrowing from the future?
But such explains the step-up in valuations.
While I understand both Sam’s and Goldman Sachs’ views, the flaw in the analysis is using the long-term mean to determine statistical relevance.
A more relevant measure of valuation reversion is by using the exponential growth trend of the valuations over the entire data series. The exponential growth trend captures the economy’s growth, earnings, and inflation over time. Importantly, it also captures the impact of slower economic growth, debt, buybacks, and retail buying in recent years.
Importantly, as shown below, valuations are indeed mean-reverting when it comes to the long-term growth trend of valuations. In particular, very high deviation levels have led to more critical mean-reverting events. (the “Crash of 1929” and the “Dot.com Crisis” in 2000)
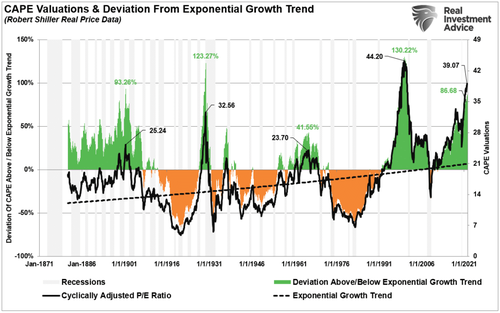
Notably, while valuations are currently at the second-highest level on record, the deviation from the long-term exponential growth trend is only the 4th highest. Such suggests that while we may indeed see a mean-reverting event in valuation below the long-term growth trend, we may not see a reversion back to 10x valuations or less. This analysis suggests that sub-10 valuations may not be seen again in our lifetimes.
However, while reversions are essential, there is a vastly more crucial point to understand.
Valuations Do Matter
“Frederick Lewis Allen once wrote, ‘Prosperity is more than an economic condition: it is a state of mind.’ Yet the current boom isn’t just a happiness survey. The numbers back me up here.
The S&P 500 has now hit 58 new all-times since the pandemic bear market ended in March 2020. Housing prices are at all-time highs. People have more equity in their homes than ever before. Wages are rising at the fastest pace in years. Economic growth is going to be at the highest level in decades in 2021.
Add it all up and the net worth of all American households is at all-time highs. But this time it’s not just the top 1% who is benefitting.” – Ben Carlson
Again, Ben is correct. However, comparing the recent liquidity-driven stock market mania to the 1920s is not exactly apples to apples.
In the short term, over one year or less, political, fundamental, and economic data has very little influence over the market.
In other words, “price is the only thing that matters” in the short term.
Price measures the current “psychology” of the “herd” and is the clearest representation of the behavioral dynamics of the living organism we call “the market.”
But in the long-term, fundamentals are the only thing that matters. Both charts below compare 10- and 20-year forward total real returns to the margin-adjusted CAPE ratio.
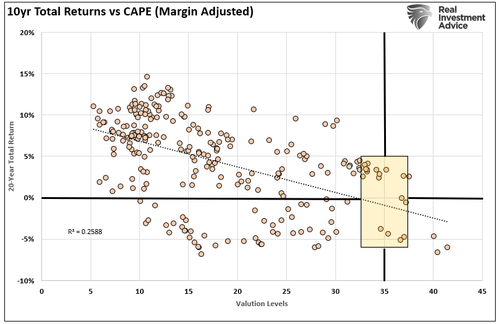
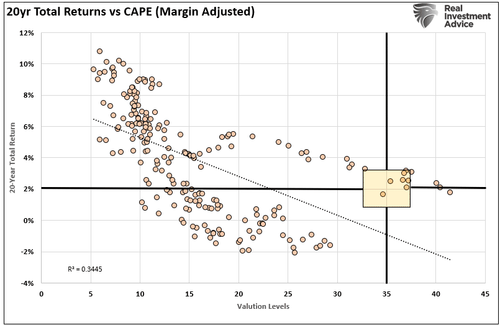
Both charts suggest that forward returns over the next decade, or two, will be somewhere between 0-3%.
There are two crucial things you should take away from the chart above concerning the 1920s analogy:
- Market returns are best when coming from periods of low valuations; and,
- Markets have a strong tendency to revert to their average performance over time.
Reversion To The Mean
As Sir Issac Newton once stated:
“What goes up, must come down.”
Looking beyond the very short-term overly optimistic view of “this time is different,” the coming unwinding of current speculative extremes will occur after completing the market cycle.
When we look at 10-year trailing returns, there is sufficient historical evidence to suggest that total returns will decline towards zero over the next 5-years from 12% annualized. (These are trailing 10-year total real returns, not forward)
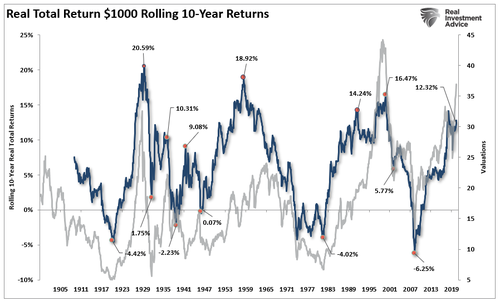
A decline in the next 3-years of only 30%, the average drawdown during a recession, will likely achieve that goal.
Why will a bear market eventually happen? It is a function of time (length of market cycles), math (valuations,) and physics (price deviations for long-term means.)
When will it happen, and what will cause it? No one knows.
While Goldman Sachs suggests there is no evidence of mean reversion, the data clearly shows there is.
Ignoring that data has cost investors dearly.