
Institutions like Nomura, JPMorgan, Rabobank, and others closely watch Commodity Trading Advisors (CTA) funds’ activities. As Nomura’s analysts found, “understanding CTA strategies “can provide a strong edge in today’s highly systematized markets.” Given that they collectively move over $300 billion in assets (plus leverage) and at times act in concert, their trade flows can trigger major moves in equities, treasury futures, and commodities. Not surprisingly, many analysts are now looking at these trade flows to explain the last three weeks’ strength in stock markets.
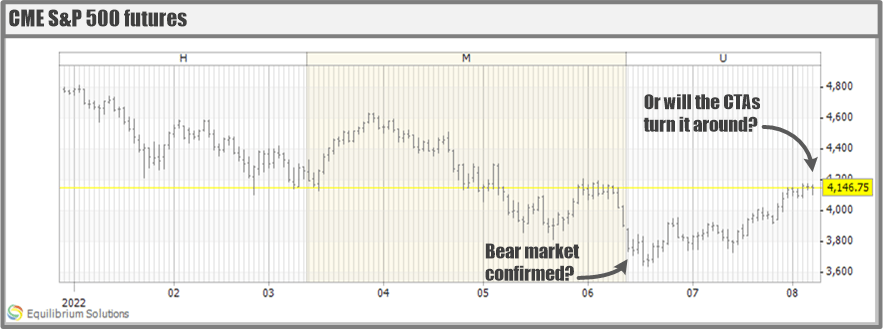
Last week, ZeroHedge summarized some of those reports which claim that last month the CTAs have covered $8 billion in short exposure, but still have an $11 billion short position in the S&P 500. Allegedly, the “systematic short covering and buying frenzy went into peak overdrive when S&P 500 rose above 4,133“ which, according to Goldman Sachs is the price trigger for the CTAs that follow medium-term trends, to join the buying after the short-term and long-term trend following CTAs already did so, bidding stocks up. The prediction for this week is that in a flat market the CTAs will cover an additional $9 billion in S&P 500, but if the rally continues this number would grow to $14 billion.
What do the actual CTA strategies indicate…
While I’m not exactly sure how Goldman’s analyst Jason Flood arrived at all these very exact predictions, as a 20-year practitioner in algorithmic trend following I can provide some color to the narrative. I track a large set of long-term, medium-term, and short-term CTA strategies and cover most of the equity indices. Apart from some profit-taking triggers, we’ve registered very few trend reversals. In fact, only the Nikkei flipped from net short to net long on Friday, 5 August. The charts below summarize the evolution of long/short exposure on main equity indices over the last 30 months according to I-System Trend Following model which has proven largely consistent with CTA indices (about 70% correlation):
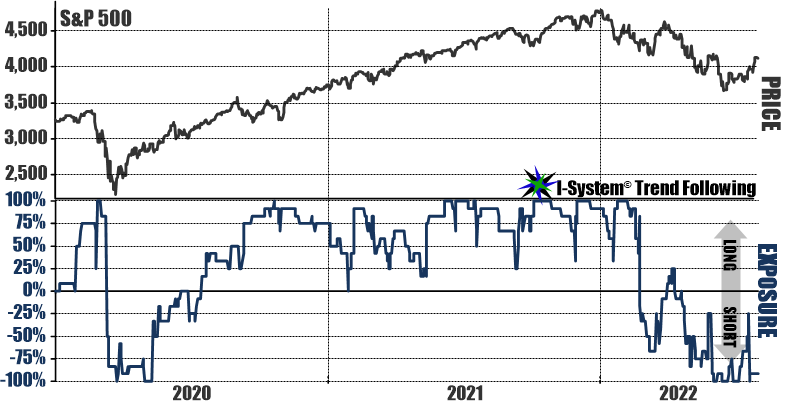
In spite of the recent rally, the S&P 500 would still be deep in the bear market territory as read by systematic trend following algorithms.
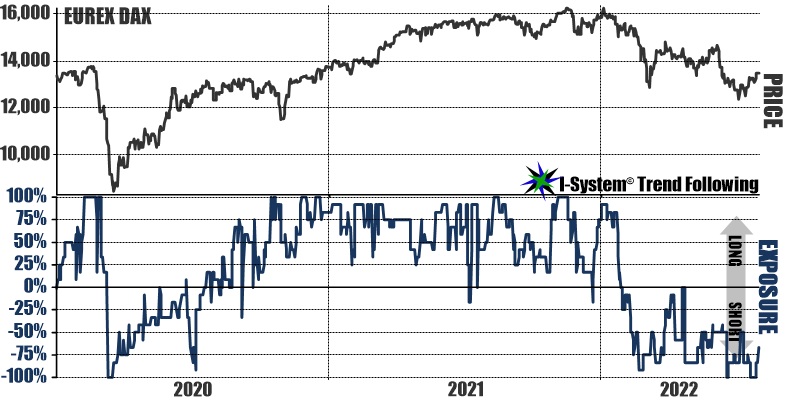
Ditto about the DAX.
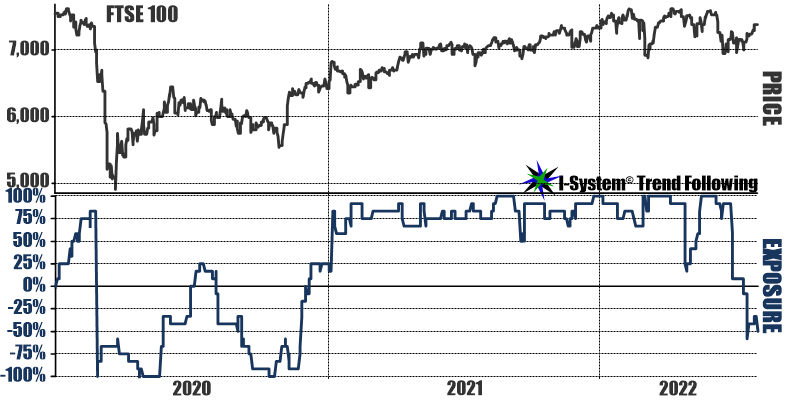
FTSE looks significantly less bearish, but its recent strength hasn’t yet moved the dial for CTA algorithms.

Nikkei 225 is the only major index we track in our Major Markets portfolio that’s actually flipped from net short to net long as late as Friday, 5 August.
As these charts suggest, the 3-week rally we just saw would not have moved the trend dial for most CTAs. For sure, there would have been some profit-taking trades, but extrapolating this to the prediction that, “the more CTAs buy… the stronger CTA buying signals will be… the higher stocks will rise, and so on in a feedback loop…” might not materialize quite as some analysts hype up. In fact, given that most models would still be trading equities on the short side, further price rallies could trigger new selling signals and insofar as CTAs can really trigger directional turns, they could easily do so to the downside.
I-System strategies are largely representative of the way successful CTAs are reading the markets at present, which would imply that this analysis is valid. Furthermore, CTA trend following models generate new signals every day and last week’s trigger prices would have moved accordingly. This fact alone should induce due skepticism about many of the forecasts invoking CTA “stampedes” and “buying frenzies”.
Explaining the events vs. navigating them
When markets move, analysts strive to offer plausible-sounding narratives to explain the moves. But figuring out the cause-and-effect relationships is never straightforward in systems as complex as global financial and commodity markets. Especially during recent months, the perfect storm of converging crises has made the hard job near impossible. Rather than guessing which way the winds will blow, investors and traders would do well to include quality trend-following strategies to help them master their directional exposure and trade timing challenges.
Over the last 30+ tumultuous months, I-System TrendFollowing has navigated the events successfully, but this was not because we accurately predicted them. We didn’t need to. The beauty of trend following is that by reacting to price fluctuations as they unfold, we can capture windfalls from large-scale price events. You can find the updated report in 18 charts covering the 190 CTA strategies comprising our Major Markets portfolio at this link. I believe it is a fair representation of the good, the bad, and the ugly of the way systematic trend following works.